Transforming Data into Strategic Business Insight
NextGen Data Consulting helps organisations turn data, research, and business information into practical strategies for growth, performance improvement, and informed decision-making.
Request a Consultation View Live Dashboard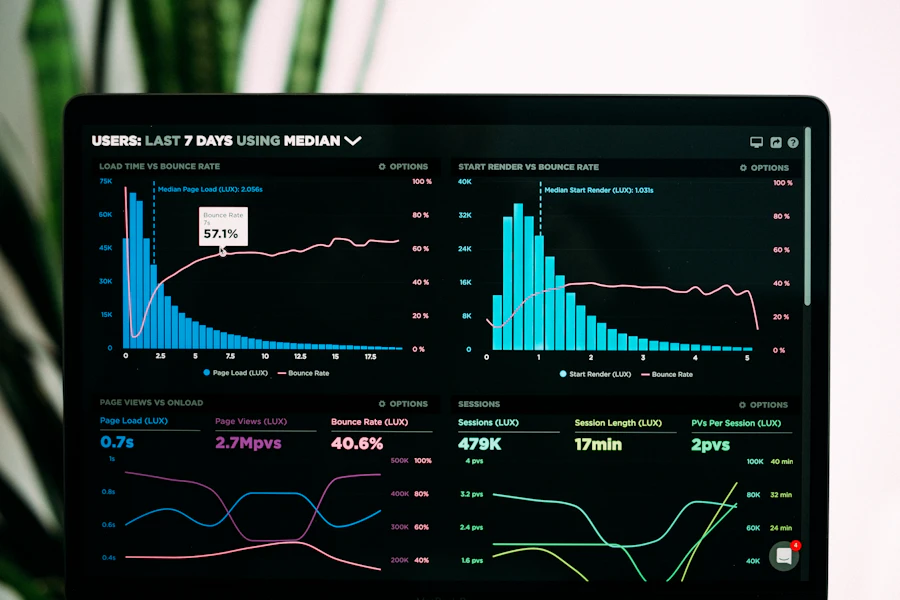
About Us
We are a business consulting firm focused on helping clients understand their data, improve operations, identify opportunities, and make evidence-based decisions.
Our Mission
To provide practical, reliable, and future-focused consulting solutions that help businesses improve performance, reduce uncertainty, and unlock new opportunities.
What We Focus On
Business intelligence, data analytics, market insights, performance reporting, strategic planning, and digital transformation support for organisations that want to compete with confidence.
Interactive Business Insight Areas
Move your mouse over each image to explore the type of consulting support we provide across analytics, retail intelligence, and executive reporting.

Business Strategy
Translate operational information into clear, evidence-based growth plans.

Retail & Wholesale Analytics
Monitor sales, orders, margins, stock movement, and product performance.

Executive Dashboards
Build automated reports for management, finance, operations, and sales teams.
Our Services
We provide consulting services designed to help businesses use information more effectively and make better strategic decisions.
Business Consulting
Support for business planning, process improvement, operational strategy, and growth-focused decision-making.
Data Analytics
Turning raw business data into clear dashboards, reports, trends, and actionable insights.
Wholesale & Retail Dashboards
Automated monitoring of sales, stock, orders, branches, customer demand, and product performance.
Market Research
Research and analysis to help organisations understand customers, competitors, market trends, and business opportunities.
Performance Reporting
Development of key performance indicators, management reports, and monitoring tools for better business control.
Digital Transformation Advisory
Guidance on using technology, automation, and data-driven systems to improve efficiency and service delivery.
Profit Protection Dashboards
Help management see where profit may be under pressure through inventory, pricing, waste, and supplier-related changes.
Inventory Availability Insights
Support better stock availability by highlighting products that need management attention.
Food-Service Waste Visibility
Help food and takeaway sections understand waste patterns and improve daily production planning.
Customer & Payment Behaviour Insights
Use anonymised payment trends to help management understand spending behaviour and customer value patterns.
Sales Sales Growth Signals
Identify practical opportunities for promotions, product placement, and sales growth.
Operational Flow Analytics
Use trading patterns to support better staff planning, smoother queues, and improved customer service.
Retail Intelligence Preview for Management
These are examples of the management insights that can help retail owners improve profitability, reduce waste, improve stock control, and grow sales. Detailed methodology is shared privately during consultation.
Profit Protection Preview
Provides management with an early-warning view of areas where profit may be under pressure.
- Highlight products needing management review.
- Surface sales areas that may require margin review.
- Show inventory value requiring attention.
Stock Availability Preview
Helps management monitor availability pressure and priority stock actions before shelves become empty.
- Highlight priority stock actions.
- Monitor high-demand categories.
- Improve visibility between shelf and stockroom availability.
Food-Service Waste Visibility
Provides a simple management view of prepared-food performance, leftovers, and waste exposure.
- Support better production planning.
- Highlight items requiring menu review.
- Monitor food-service cost pressure.
Anonymised Customer Behaviour Preview
Uses anonymised payment and transaction trends to understand customer value, spending behaviour, and payment preferences.
- Group customer behaviour into useful management views.
- Monitor payment behaviour trends.
- Understand available payment-channel patterns.
Promotion Opportunity Preview
Shows opportunities for better product placement, promotions, and sales-growth campaigns.
- Identify demand relationships.
- Support promotion planning.
- Support improved merchandising decisions.
Trading Flow Preview
Shows trading-period patterns that support smoother customer flow and better staff planning.
- Highlight busy trading periods.
- Monitor transaction flow by service point.
- Support better customer service planning.
Management Insight Preview
A simplified public demo of management-level insight categories
Profit Protection Signals
| Issue | Value | Risk |
|---|---|---|
| Margin pressure | N$ 12,800 | High |
| Inventory pressure | N$ 34,600 | Medium |
| Waste exposure | N$ 8,900 | High |
Sales Growth Signals
| Opportunity | Recommendation |
|---|---|
| Product pairing opportunity | Promotion planning |
| Busy trading period | Service planning |
| High-value basket segment | Value-based promotion |
Management Action Signals
| Action | Priority |
|---|---|
| Review priority stock | Urgent |
| Review prepared-food plan | Review |
| Review margin pressure | Urgent |
Automatic Dashboard
This sample dashboard refreshes automatically to demonstrate how your reports can display live business metrics, trends, and performance indicators.
Revenue Trend
Department Performance
Retail Performance Demo Dashboard
A public demo showing how retail performance can be monitored during normal trading hours, using sample transaction data and simplified management views.
Category Movement
Cash vs Swipe
Latest Demo Transactions
| Time Purchased | Product Sold | Category | Payment | Price | Shop Name | Cashier ID | Qty |
|---|
Service Point Sales Snapshot
A public sample of how service-point activity can be summarised for management.
Product Movement Snapshot
A public sample of how product movement can be summarised.
Inventory Attention Watchlist
A public sample of how slow-moving inventory can be highlighted for review.
Wholesale / Retail Dashboard
A sample analytics dashboard for wholesalers, distributors, supermarkets, shops, pharmacies, clothing stores, hardware stores, and other retail businesses.
Channel Overview
Sales by Channel
Top Product Movement
| Product Category | Sales | Stock Status | Action |
|---|
Before vs After NextGen Data Consulting
The value is not only in dashboards. The value is in better management decisions, faster response, and reduced loss.
Before
- Decisions based on memory, assumptions, and manual checking.
- Expiry losses discovered after stock has already gone bad.
- Supplier price increases reduce margins silently.
- Stock-outs are noticed by customers first.
- Takeaway waste is visible but not measured properly.
- Promotions are designed without basket evidence.
After
- Dashboards show profit, stock, waste, and customer behaviour.
- Expiry and waste risks are flagged early.
- Margin pressure is detected before profit disappears.
- Fast-moving products trigger reorder alerts.
- Takeaway production is planned using demand patterns.
- Bundles and cross-selling are based on real purchases.
Start with a 30-Day Retail Analytics Pilot
Use one month of real sales, stock, supplier, and takeaway data to show the owner where money is made, where money is lost, and which actions management should take next.
Why Choose NextGen Data Consulting?
We combine analytical thinking, business understanding, and practical consulting experience to deliver insights that clients can use.
Contact Us
Ready to reduce losses, improve stock control, grow sales, and manage your retail business with better insights?
Email: info@nextgendataconsulting.com
Phone: +264 81 395 9637
Location: Namibia
Send an Email